Bitcoin (BTC) circled $23,500 on Feb. 4 as bulls refused to give up support in out-of-hours trading.

Bitcoin price conjures 2020 memories
Data from Cointelegraph Markets Pro and TradingView showed BTC/USD holding a narrow range in place since the Feb. 3 Wall Street open.
Macroeconomic data releases from the United States provided modest volatility but no overall trend change as traders bided their time heading into the weekend.
Opinions on the longer-term outlook were mixed, however, with some maintaining that there was little reason to trust that Bitcoin’s rally would continue.
“Seeing $50,000 calls already on Bitcoin and we have yet to complete a higher high and higher low market structure change,” popular trader Crypto Tony summarized in part of a tweet on the day.
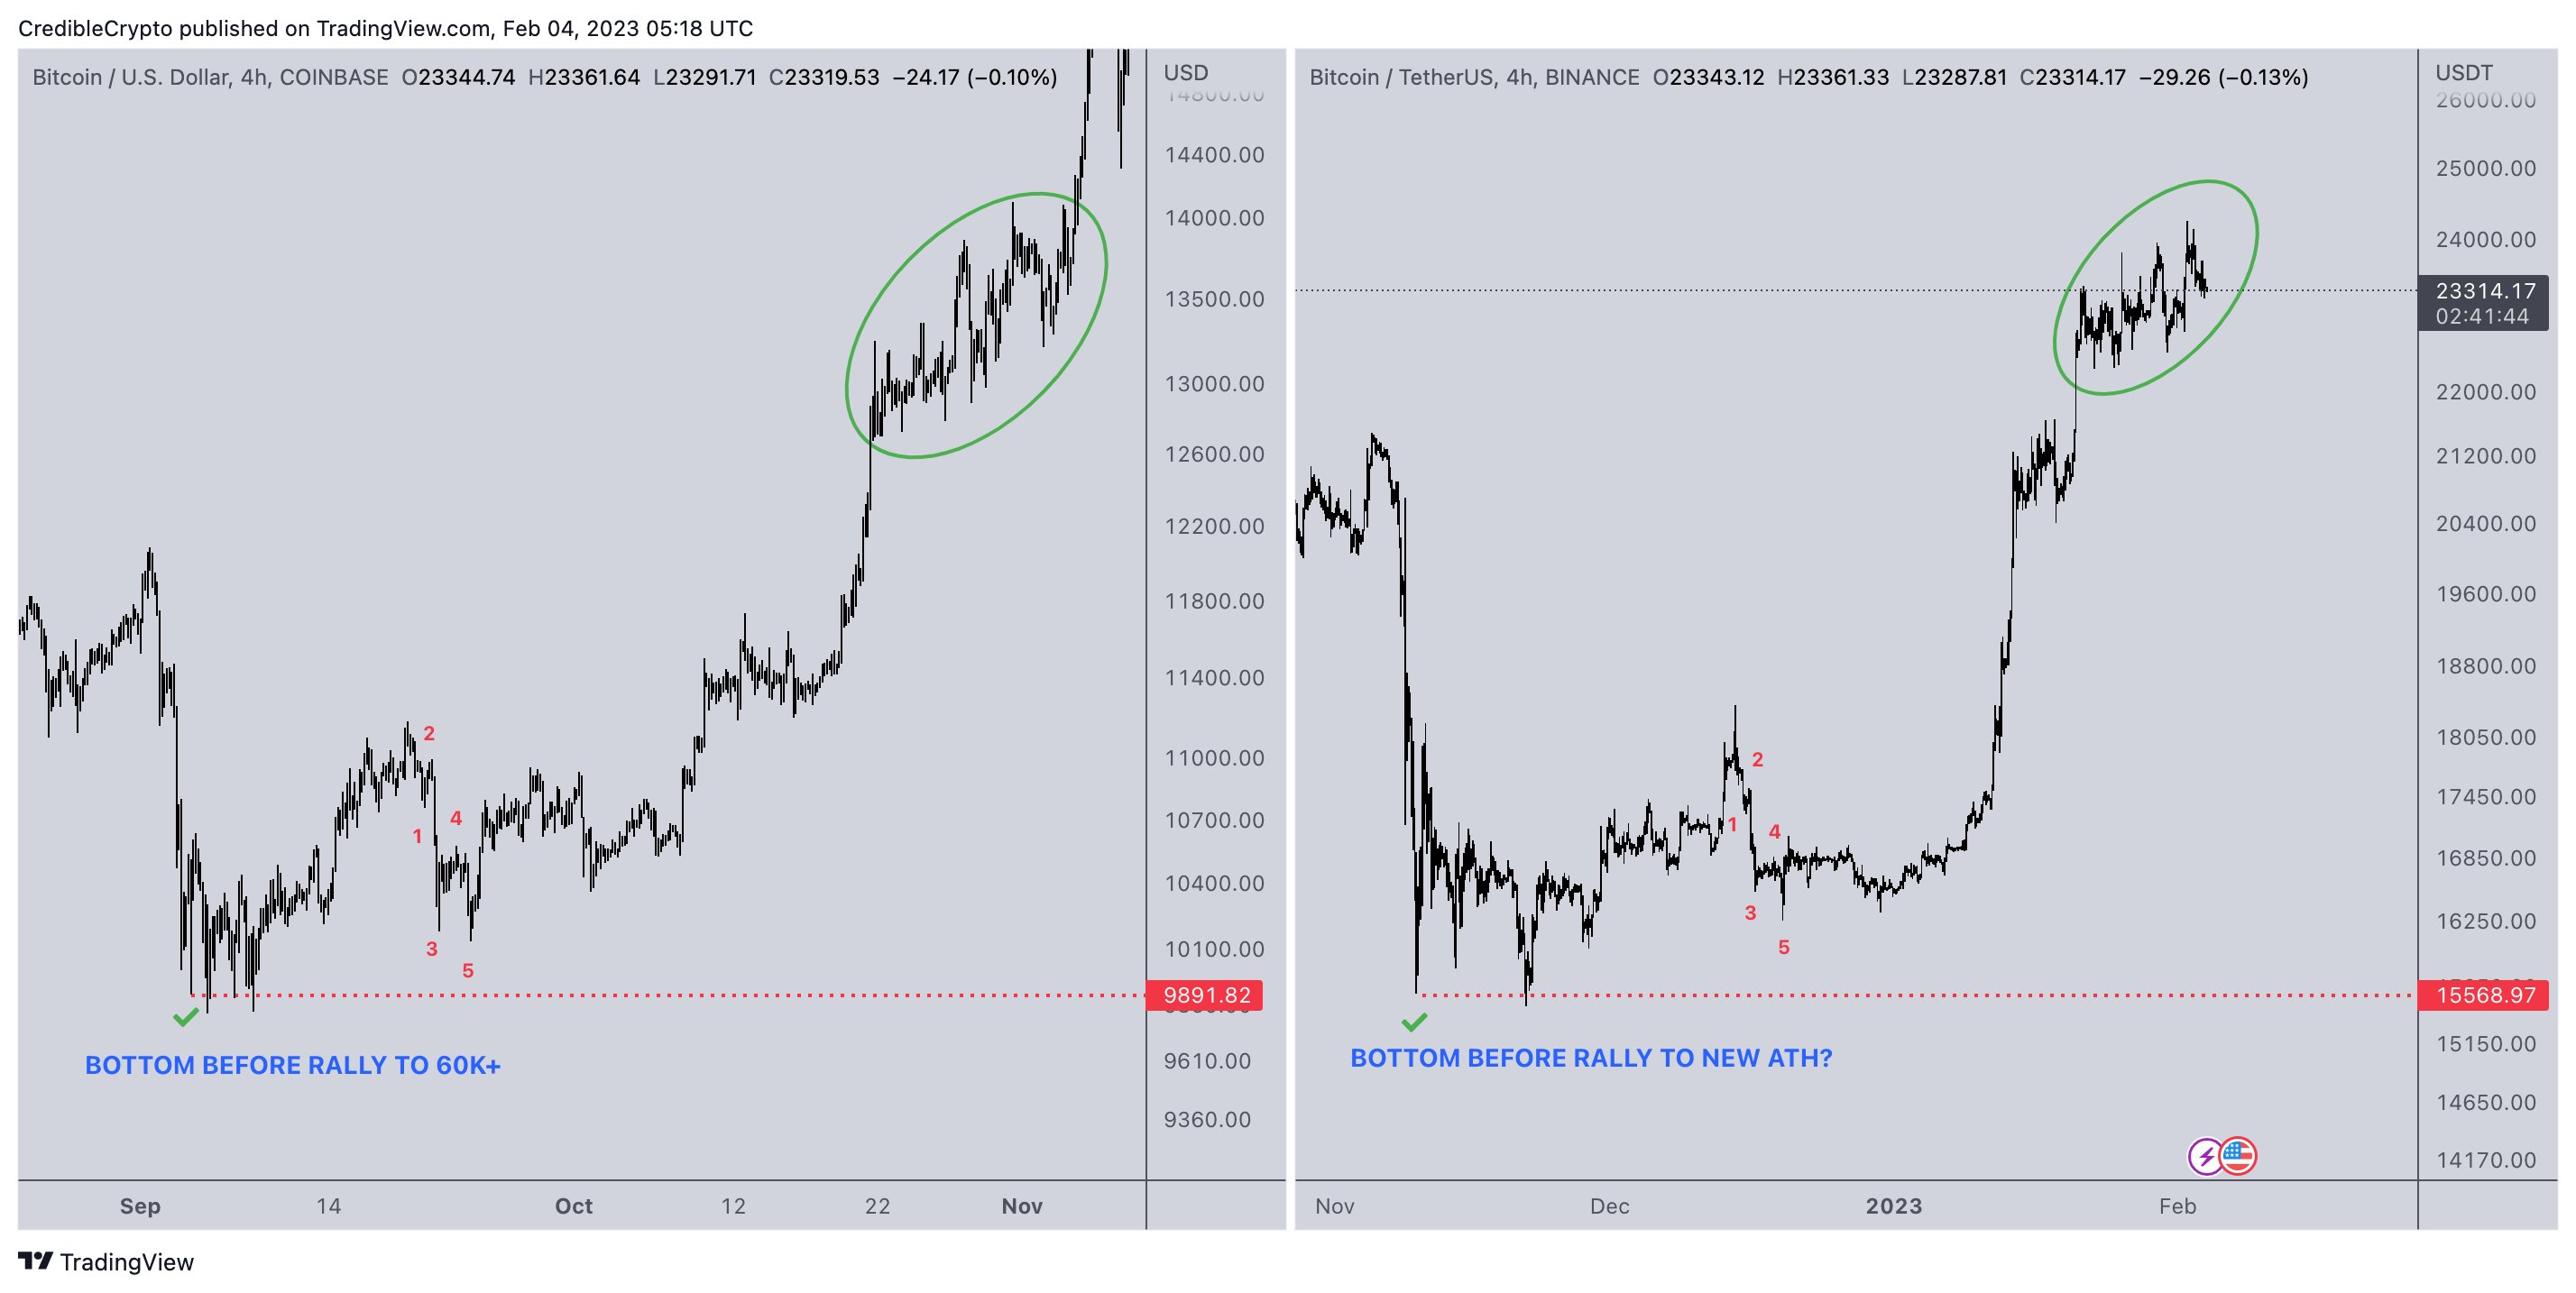
More optimistic was fellow trader Credible Crypto, who doubled down on a theory that compared current BTC price action to that of late 2020, just after Bitcoin had passed its old 2017 all-time high.
“Price action has developed beautifully off our lows, mimicking the bottom formation that preceded our last impulse from 10k-60k+. Current consolidation (circled in green) also looks identical to PA from that impulse,” he wrote in an update to a corresponding Twitter thread.
“BTC may continue to pump while most wait for a pullback…”

Others were concerned about a turnaround in the fortunes of the U.S. dollar, which could impact risk assets across the board if it were to continue.
The U.S. Dollar Index (DXY) was “ringing up alarm bells” for popular trader Bluntz, who revealed a segue into stablecoins.
“After such a long and deep sell-off, do we think the DXY is already done on the upside? I don’t. Lotta shorts to squeeze yet,” macro investor David Brady commented about the dollar’s decline from twenty-year highs in Q3 2022.

RSI poised for “bullish continuation”
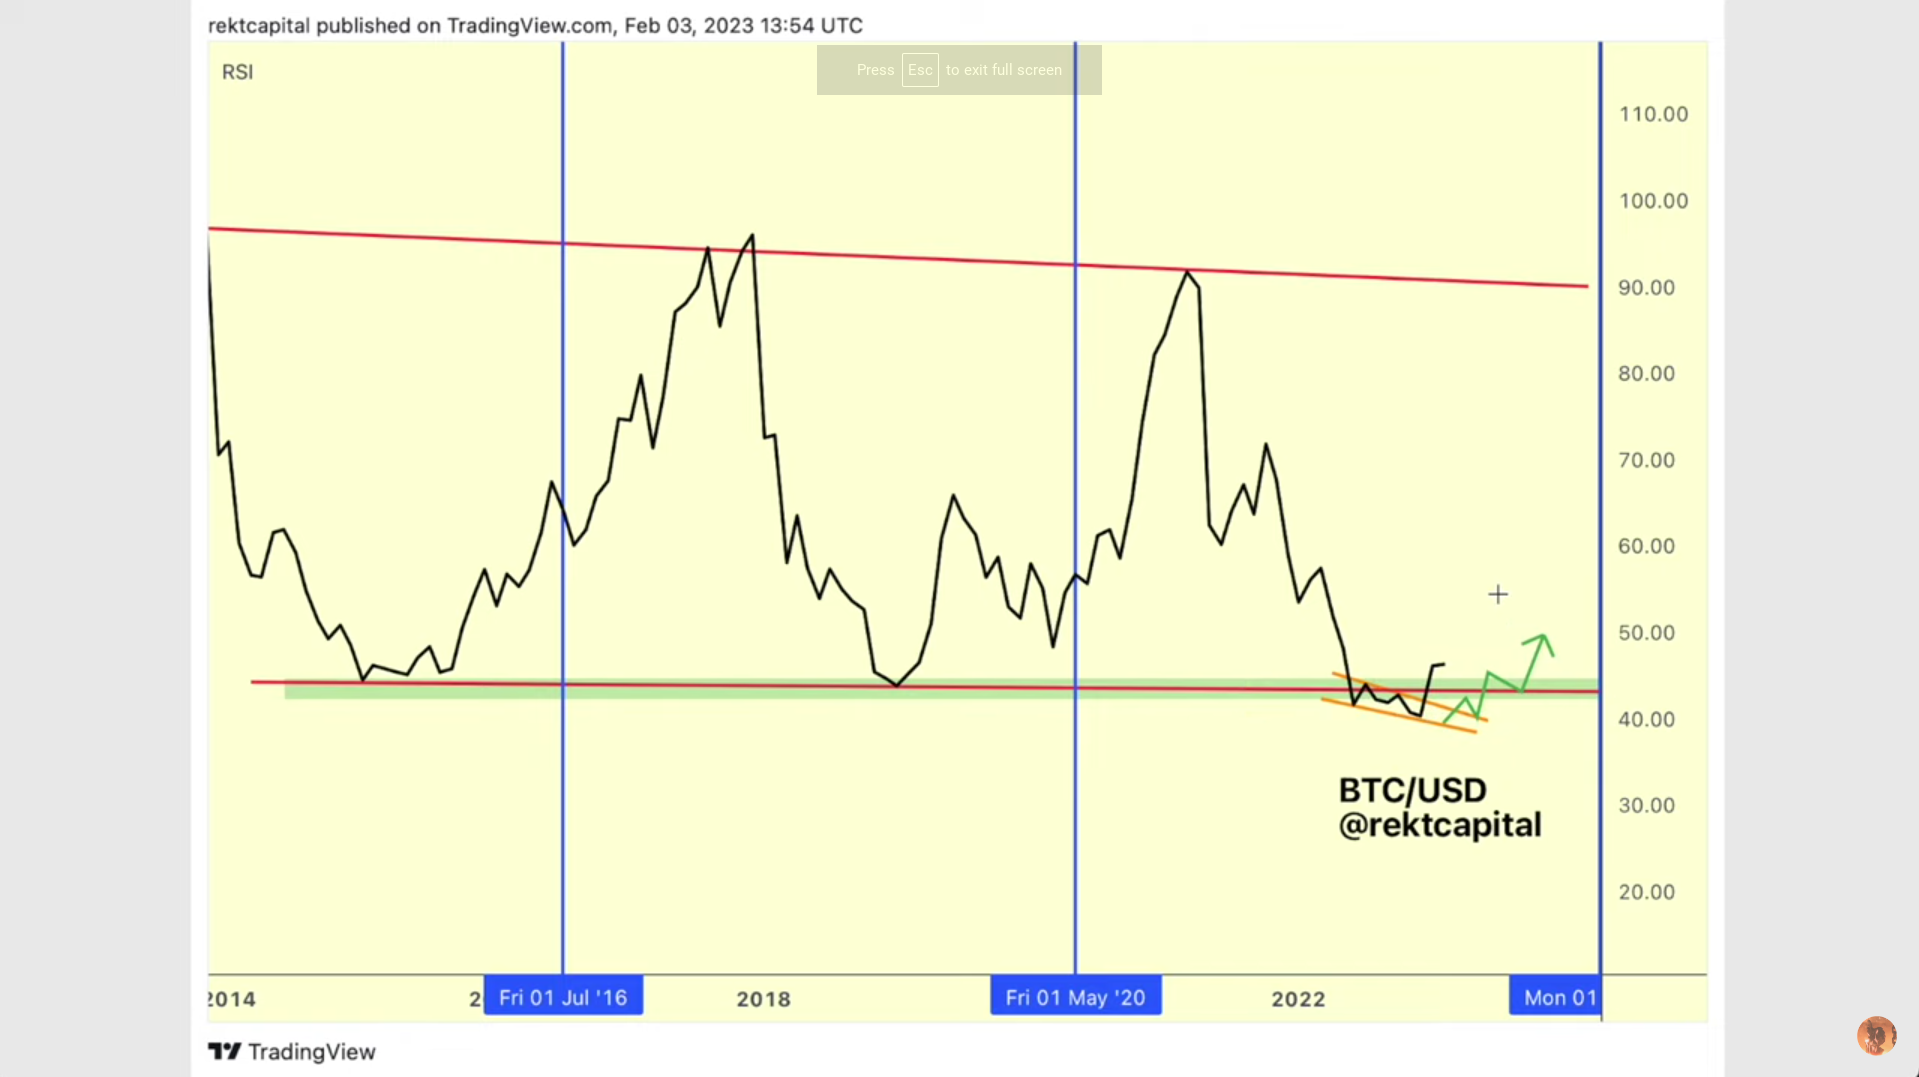
Focusing on monthly timeframes, meanwhile, trader and analyst Rekt Capital eyed a potential cue for Bitcoin to dip before continuing higher.
This came in the form of its relative strength index (RSI), which in January bounced from all-time lows to reclaim a key support level.
While acknowledging that historically, Bitcoin markets “haven’t really seen double bottoms” in RSI, he argued that there was still a chance that a higher low could come next.
“Now just reaffirming and keeping these levels consistent and stable — that’s what we really want to see for bullish continuation, ” he concluded in a YouTube video released on Feb. 3.

A Twitter survey from Rekt Capital likewise delivered a narrow consensus that a dip should come for BTC/USD.
The views, thoughts and opinions expressed here are the authors’ alone and do not necessarily reflect or represent the views and opinions of Cointelegraph.
Main content of the article:
Summarize this content to 120 words Bitcoin (BTC) circled $23,500 on Feb. 4 as bulls refused to give up support in out-of-hours trading.BTC/USD 1-hour candle chart (Bitstamp). Source: TradingViewBitcoin price conjures 2020 memoriesData from Cointelegraph Markets Pro and TradingView showed BTC/USD holding a narrow range in place since the Feb. 3 Wall Street open. Macroeconomic data releases from the United States provided modest volatility but no overall trend change as traders bided their time heading into the weekend.Opinions on the longer-term outlook were mixed, however, with some maintaining that there was little reason to trust that Bitcoin’s rally would continue.“Seeing $50,000 calls already on Bitcoin and we have yet to complete a higher high and higher low market structure change,” popular trader Crypto Tony summarized in part of a tweet on the day.More optimistic was fellow trader Credible Crypto, who doubled down on a theory that compared current BTC price action to that of late 2020, just after Bitcoin had passed its old 2017 all-time high.“Price action has developed beautifully off our lows, mimicking the bottom formation that preceded our last impulse from 10k-60k+. Current consolidation (circled in green) also looks identical to PA from that impulse,” he wrote in an update to a corresponding Twitter thread. “BTC may continue to pump while most wait for a pullback…”BTC/USD comparative charts. Source: Credible Crypto/ TwitterOthers were concerned about a turnaround in the fortunes of the U.S. dollar, which could impact risk assets across the board if it were to continue.The U.S. Dollar Index (DXY) was “ringing up alarm bells” for popular trader Bluntz, who revealed a segue into stablecoins.“After such a long and deep sell-off, do we think the DXY is already done on the upside? I don’t. Lotta shorts to squeeze yet,” macro investor David Brady commented about the dollar’s decline from twenty-year highs in Q3 2022.U.S. Dollar Index (DXY) 1-day candle chart. Source: TradingViewRSI poised for “bullish continuation”Focusing on monthly timeframes, meanwhile, trader and analyst Rekt Capital eyed a potential cue for Bitcoin to dip before continuing higher.Related: Bitcoin due new ‘big rally’ as RSI copies 2018 bear market recoveryThis came in the form of its relative strength index (RSI), which in January bounced from all-time lows to reclaim a key support level.While acknowledging that historically, Bitcoin markets “haven’t really seen double bottoms” in RSI, he argued that there was still a chance that a higher low could come next.“Now just reaffirming and keeping these levels consistent and stable — that’s what we really want to see for bullish continuation, ” he concluded in a YouTube video released on Feb. 3.Bitcoin relative strength index (RSI) annotated chart (screenshot). Source: Rekt Capital/ YouTubeA Twitter survey from Rekt Capital likewise delivered a narrow consensus that a dip should come for BTC/USD.The views, thoughts and opinions expressed here are the authors’ alone and do not necessarily reflect or represent the views and opinions of Cointelegraph.


