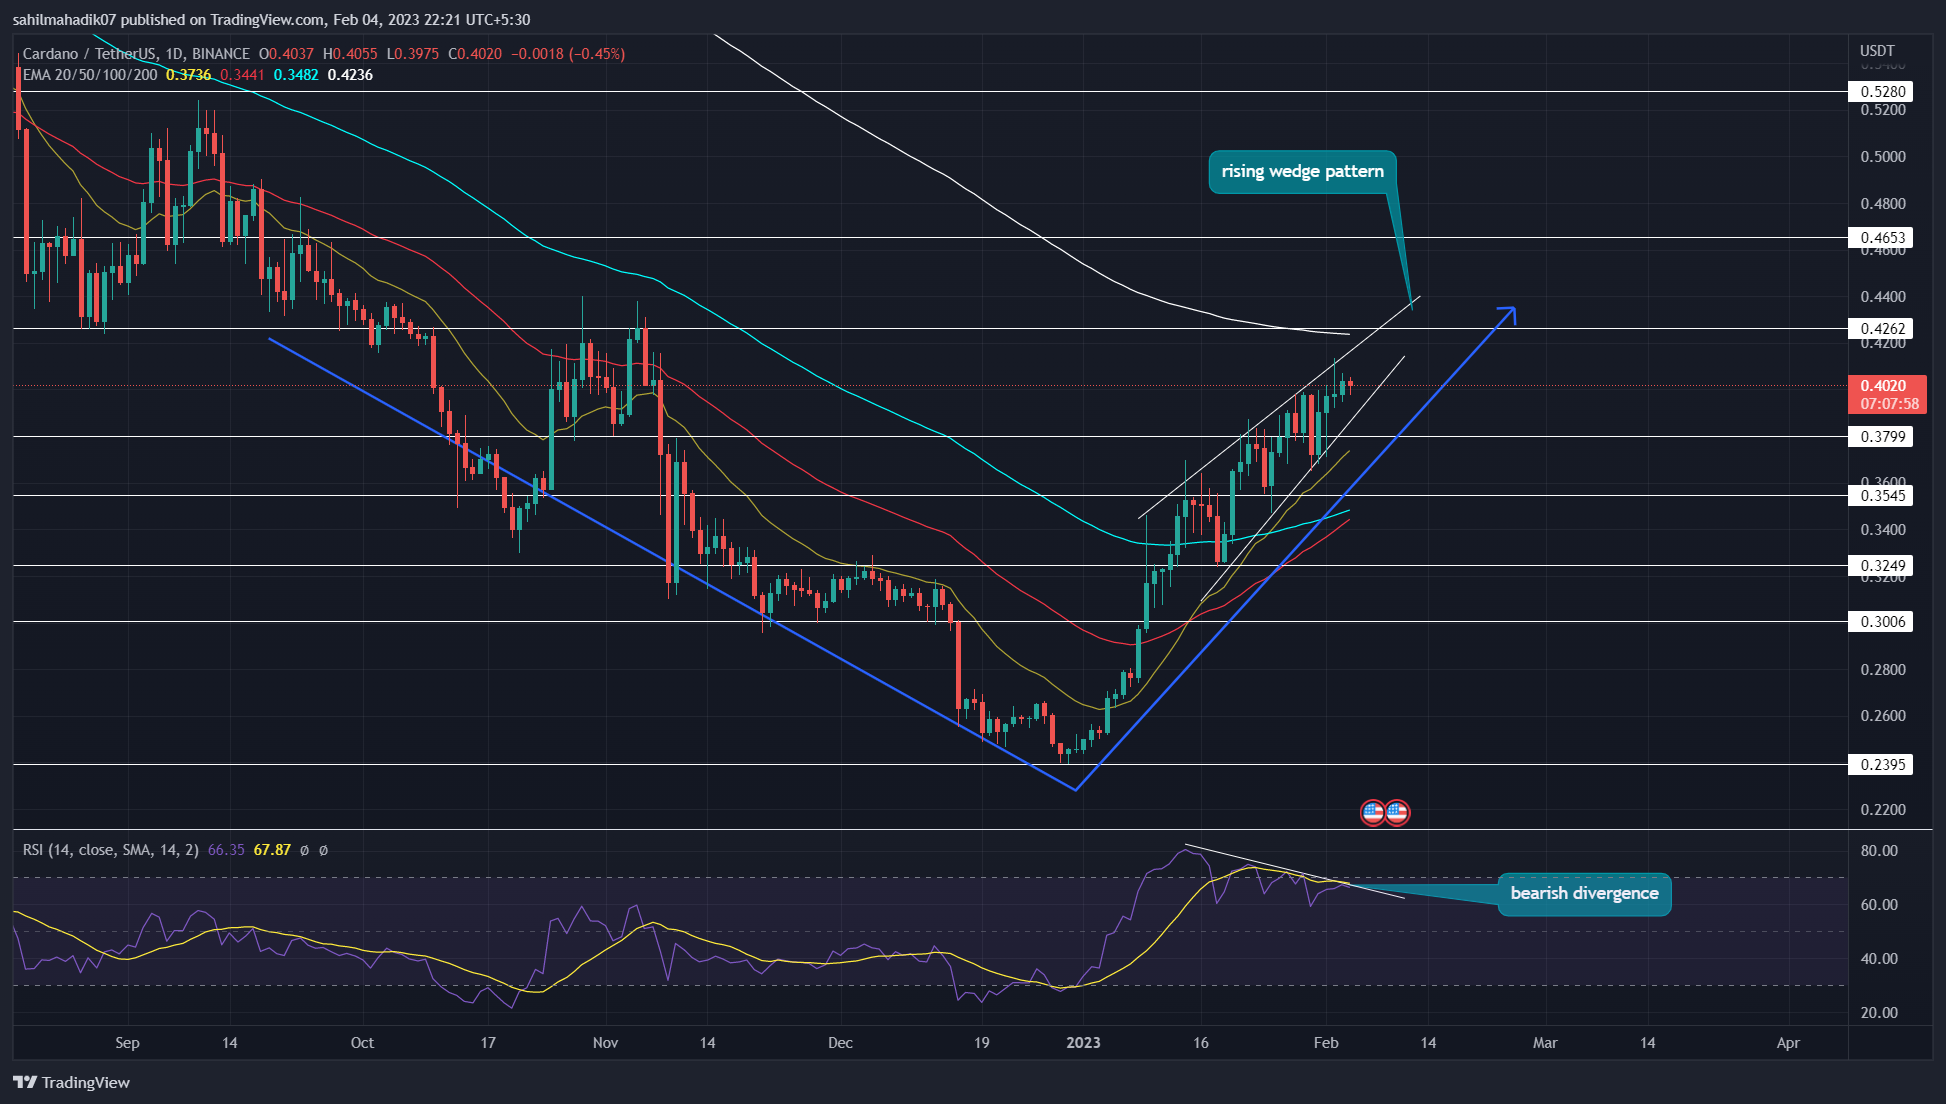
Concerning the recent new year’s recovery, the Cardano coin price shows a V-shaped recovery in the daily time frame chart. In theory, this recovery describes a rapid and strong rebound in its bullish momentum following a sharp decline. However, amid this recovery, the coin chart revealed the formation of a rising wedge pattern.
Key Points:
- In core concept, this rising wedge pattern is considered bearish because it signals a potential reversal in the current uptrend and a shift towards a downtrend.
- A breakdown below the pattern’s support trendline could trigger a direction downfall.
- The intraday trading volume in the ADA coin is $275.4 Billion, indicating a 24% gain.
 Source- Tradingview
A rising wedge pattern is a charting pattern that is formed when the price of an asset rises along with two converging trend lines. The upper trend line connects a series of higher highs and the lower trend line connects a series of higher lows.
The Cardano coin price continues to wobble inside the aforementioned pattern but shows weakness in the uptrend as each successive swing high is struggling to reach a considerable height. By the press time, the coin price trades at $0.4 but if the selling pressure increases it is likely to break the lower support trendline.
This breakdown will intensify the bearish momentum and trigger a minor correction phase. Anyhow, this pullback is needed as the Cardano coin price has not taken a sufficient break since the new recovery cycle began.
This potential downfall could tumble the price 20% down to reach the $0.345 support. However, some in-between supports that may resume the prevailing bullish recovery a bit earlier are $0.378 and $0.3545.
On a contrary note, the ongoing bullish rally will continue until the wedge pattern is intact.
Technical Indicator.
Relative strength index: concerning the rising price action, the falling RSI slope indicates weakness in bullish momentum. This bearish divergence supports the above-mentioned pullback theory.
EMA’s: the 50-and-100-day EMA nearing a bullish crossover could extend the ongoing bull run for a few more trading sessions.
Cardano Coin Price Intraday Levels
- Spot price: $0.4
- Trend: Bearish
- Volatility: Medium
- Resistance level- $0.426 and $0.465
- Support level- $0.378 and $0.3545.
Main content of the article:
Summarize this content to 120 words
Concerning the recent new year’s recovery, the Cardano coin price shows a V-shaped recovery in the daily time frame chart. In theory, this recovery describes a rapid and strong rebound in its bullish momentum following a sharp decline. However, amid this recovery, the coin chart revealed the formation of a rising wedge pattern.
Key Points:
In core concept, this rising wedge pattern is considered bearish because it signals a potential reversal in the current uptrend and a shift towards a downtrend.
A breakdown below the pattern’s support trendline could trigger a direction downfall.
The intraday trading volume in the ADA coin is $275.4 Billion, indicating a 24% gain.
Source- Tradingview
A rising wedge pattern is a charting pattern that is formed when the price of an asset rises along with two converging trend lines. The upper trend line connects a series of higher highs and the lower trend line connects a series of higher lows.
The Cardano coin price continues to wobble inside the aforementioned pattern but shows weakness in the uptrend as each successive swing high is struggling to reach a considerable height. By the press time, the coin price trades at $0.4 but if the selling pressure increases it is likely to break the lower support trendline.
This breakdown will intensify the bearish momentum and trigger a minor correction phase. Anyhow, this pullback is needed as the Cardano coin price has not taken a sufficient break since the new recovery cycle began.This potential downfall could tumble the price 20% down to reach the $0.345 support. However, some in-between supports that may resume the prevailing bullish recovery a bit earlier are $0.378 and $0.3545.
On a contrary note, the ongoing bullish rally will continue until the wedge pattern is intact.
Technical Indicator.
Relative strength index: concerning the rising price action, the falling RSI slope indicates weakness in bullish momentum. This bearish divergence supports the above-mentioned pullback theory.
EMA’s: the 50-and-100-day EMA nearing a bullish crossover could extend the ongoing bull run for a few more trading sessions.
Cardano Coin Price Intraday Levels
Spot price: $0.4
Trend: Bearish
Volatility: Medium
Resistance level- $0.426 and $0.465
Support level- $0.378 and $0.3545.
Close Story


